What Buyers Want—Recent Consumer Preference Research
July 2019
Two recent studies shed light on consumer preferences, helping builders differentiate their product from resales and deliver (and sell) more desirable homes and communities.
By Rich Binsacca, Editor-in-Chief
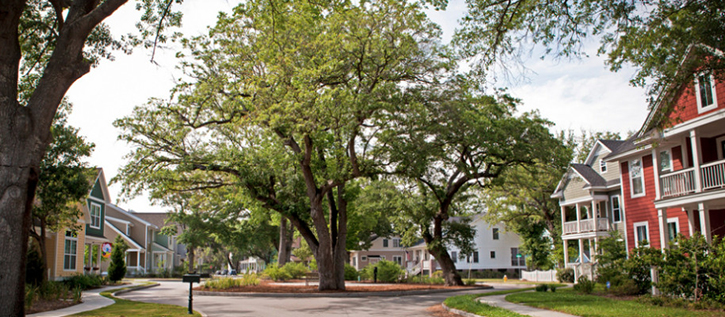
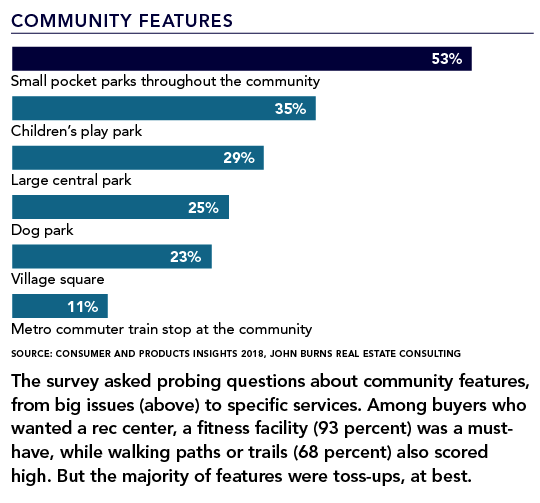
Pocket parks, like this one in Oak Terrace Preserve, in North Charleston, S.C., are a community feature desired by 53 percent of survey respondents. (Photo: Flickr user North Charleston, CC BY-SA 2.0)
In study after study, the differences between what buyers say they want and what builders and developers actually deliver show significant gaps. Fortunately, there's an increasing wealth of consumer preference research out there to help align builders with buyer desires.
One such study, Consumer and Products Insights, released last year by John Burns Real Estate Consulting, is a don't miss for home builders. Culled from more than 21,000 new-home shoppers nationwide, representing every demographic swath and slice, the report delivers a road map to meeting demand based on homebuyer income and down-payment expectations, home design and community preferences, motivations for moving that consider household formations and life stages, and obstacles to homeownership.
Among the highlights, the John Burns survey found that: the percentage of full-time dual-income couples falls from 82 percent before kids to 54 percent once the first child is born—a factor that affects affordability and attainable mortgage loans; that just 20 percent of all home shoppers will commute longer for more value—a red flag for sprawl; that almost half (47 percent) of all home shoppers could do without a community or rec center; that barriers to homeownership center on lack of options and affordability; and, perhaps most significantly, that new-home shoppers hate the limitations of resale homes that lack first-floor master suites, open floor plans, and energy-saving features—a clear guide for new-home product design and sales differentiation.
Meanwhile, the latest quarterly Housing Trends Report from NAHB indicates similar consumer data regarding obstacles to homeownership, specifically why most active shoppers haven't yet bought a home after more than three months (spoiler alert: it's affordability, but not always). Still, nearly two-thirds of home shoppers say they'll continue to look for the right home in the right place at the right price; only 18 percent will give up.
Methodology and respondent information: John Burns Real Estate Consulting, based in Irvine, Calif., collected 21,114 completed surveys via email in the fourth quarter of 2017 and released its report, Consumer and Products Insights, in 2018. Click here for the full report. NAHB derived its Housing Trends Report for Quarter 3, 2018, from 20,051 representative samples of American adults across the country conducted between Sept. 25 and Oct. 8, 2018; all data are derived by Morning Consult on NAHB's behalf.
(House icon: martialred / stock.adobe.com)
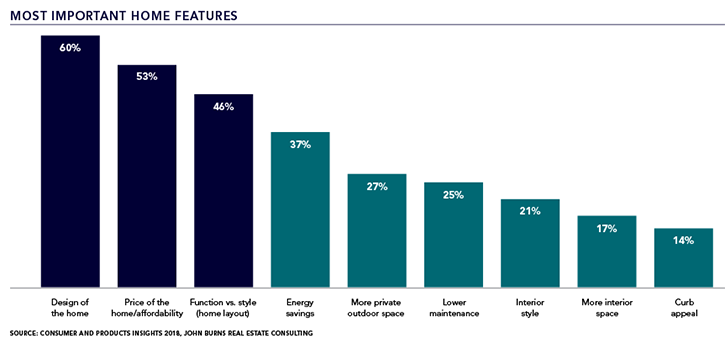
It may surprise builders that price is no longer the No. 1 factor among new-home shoppers, supplanted in this study by the home's overall design. The report also revealed that 53 percent of detached-home buyers and 32 percent of attached-home buyers prefer single-level homes, by far the most desired housing type. (See more detail about builder vs. buyer views of green.)
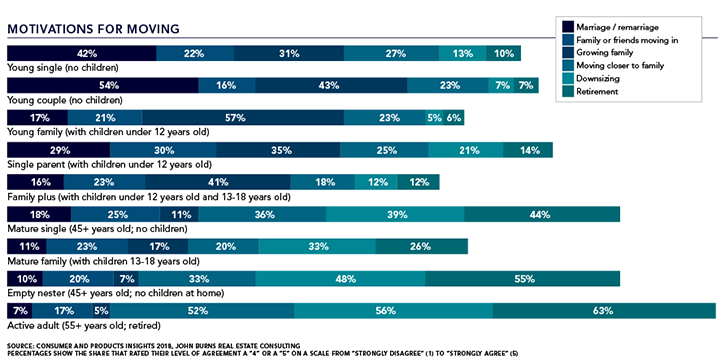
Across all life stages, the motivation to move into a newly built home is driven by investment potential (83 percent), better layout (78 percent), and relatively low mortgage interest rates (72 percent), among other financial and home-design catalysts. But broken down by household formations (above), lifestyle motivations—from marriage to retirement, and kids or no kids—play a larger role in why they move. In short, know the life stages of your target buyers and tailor your product and messages accordingly.
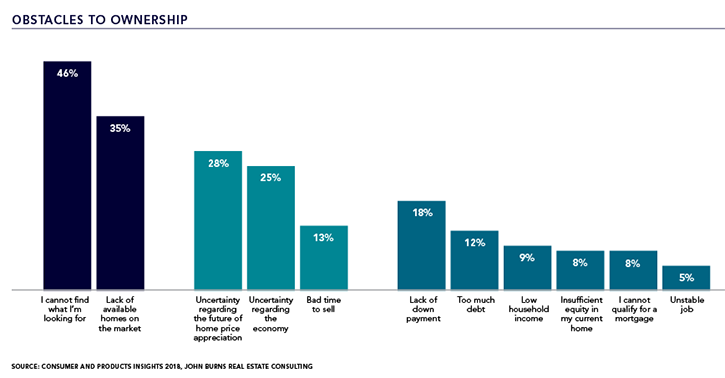
It's a telling sign of the times when 46 percent of new-home shoppers can't find what they're looking for and 35 percent find the number of new homes lacking in their market. Less than a third of home shoppers are uncertain about the market, probably because their personal financial conditions (income, home equity, debt, job security) currently pose few barriers to buying.
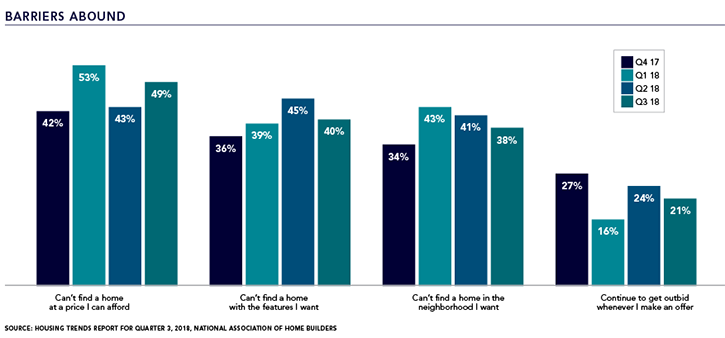
NAHB's study echoes and amplifies those obstacles (previous chart), further qualifying buyers' inability to find a new home they can afford, with the features they want, or in a desired neighborhood—sentiments that have been going on for at least a year—and raising a telling red flag to builders.
Source: Professional Builder